


Finding the best way to use TradingView for analysis comes down to more than just picking a few indicators and hoping for the best. TradingView packs an enormous amount of functionality into one platform, and most traders only scratch the surface — sticking to default settings and a cluttered chart instead of building a clean, repeatable analysis workflow. This guide covers seven practical ways to get more out of the platform, whether you’re just starting out or looking to tighten up an existing routine.
None of these tips require advanced technical skill or a premium subscription to start applying. What separates traders who get real value from TradingView isn’t access to more features — it’s a deliberate, repeatable way of using the ones already available.
Why Your TradingView Setup Matters More Than You Think
A cluttered, inconsistent chart setup slows down analysis and makes it easier to miss what actually matters. The best way to use TradingView for analysis starts with treating your workspace as a tool that should be deliberately configured, not left on default settings. Traders who build a clean, repeatable setup tend to spot valid setups faster and with more confidence than those recreating their chart layout from scratch every session.
7 Powerful Tips for Using TradingView Effectively
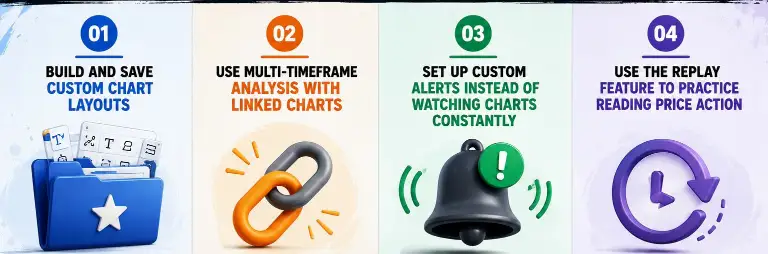
1. Build and Save Custom Chart Layouts
Rather than reconfiguring indicators and timeframes every time you open a chart, TradingView lets you save complete layouts — including drawings, indicators, and timeframe splits — as templates. Setting up one layout for trend analysis and another for entry timing saves significant time and keeps your process consistent across sessions.
2. Use Multi-Timeframe Analysis With Linked Charts
TradingView’s multi-chart layouts let you view the same pair across several timeframes simultaneously, with the option to sync crosshairs and symbol changes across all of them. This makes top-down analysis — checking higher timeframe structure before dropping to a lower timeframe for entries — far faster than switching timeframes one at a time on a single chart.
3. Set Up Custom Alerts Instead of Watching Charts Constantly
One of the best ways to use TradingView for analysis is by taking advantage of its powerful alert system. TradingView alerts can be triggered by price levels, indicator crossovers, or even custom Pine Script conditions. Instead of constantly watching the charts, traders can rely on alerts to notify them when important levels are reached. This helps reduce unnecessary screen time, minimizes anxiety-driven chart checking, and lowers the likelihood of making impulsive trading decisions.
4. Use the Replay Feature to Practice Reading Price Action
The Bar Replay tool lets you step through historical price action candle by candle, as if it were happening live. This is one of the most underused features for building genuine chart-reading skill, since it lets you practice identifying structure and setups without the pressure of real capital on the line.
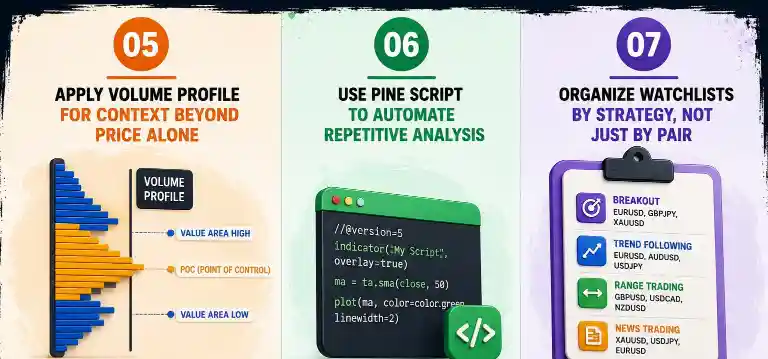
5. Apply Volume Profile for Context Beyond Price Alone
Volume Profile tools show where the most trading activity has occurred at specific price levels, adding a layer of context that price action alone doesn’t provide. High-volume nodes often act as meaningful support or resistance zones, which can sharpen entries identified through other methods.
6. Use Pine Script to Automate Repetitive Analysis
Another best way to use TradingView for analysis is by taking advantage of Pine Script. Even without advanced coding knowledge, traders can create simple custom indicators or automatically highlight specific market conditions, such as candlestick patterns or strategy-based signals. This reduces the need for manual chart scanning and makes it easier to identify potential trade setups across multiple markets in less time.
7. Organize Watchlists by Strategy, Not Just by Pair
Rather than one long list of every pair you follow, separate watchlists built around specific strategies or setups — trend continuation, range-bound pairs, high-volatility pairs — make it easier to scan for the right conditions quickly instead of manually filtering a single long list every session.
Using the Screener to Find Setups Faster
Another best way to use TradingView for analysis is by using the built-in Screener to filter the market based on technical criteria such as RSI levels, moving average crossovers, or volatility. Instead of manually checking dozens of charts, traders can quickly identify potential trading opportunities that match their strategy. This is especially useful for those who monitor multiple currency pairs or different asset classes.
For even greater efficiency, combine the Screener with a saved watchlist and chart layout. Run your preferred filters, add qualifying pairs to your watchlist, and then analyze each chart using your saved layout. This structured workflow helps traders review the market more consistently and reduces the chance of missing quality trade setups.
Adapting Your TradingView Workflow to Your Trading Style
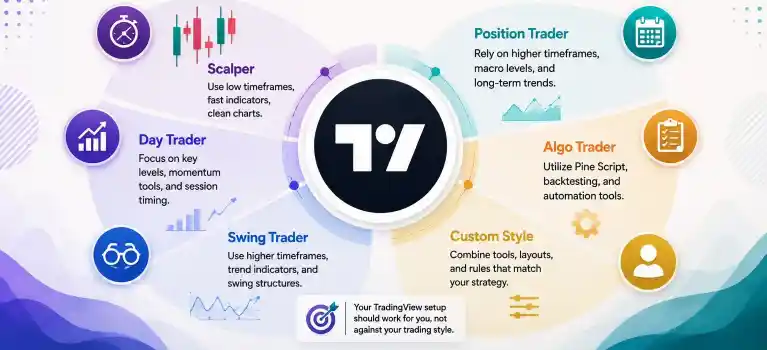
The best way to use TradingView for analysis depends on your trading style. Scalpers and day traders often benefit from lower-timeframe chart layouts, fast-updating alerts, and a smaller watchlist that can be monitored throughout the trading session. Swing and position traders, on the other hand, usually find greater value in higher-timeframe multi-chart layouts and more selective screener filters, as they focus on high-quality setups that develop over several days rather than minutes.
Rather than copying someone else’s workspace, build a TradingView setup that matches your own strategy and holding period. A workflow tailored to your trading style is more effective than using a generic chart layout that doesn’t align with your trading objectives.
Combining TradingView With Your Broader Trading Process
TradingView is a charting and analysis tool, not a full trading plan on its own. The best way to use TradingView for analysis is as one component of a broader, disciplined process — pairing your chart setup with fixed position sizing and a clear stop-loss method rather than treating chart analysis as the entire decision. Our guide on how to use ATR in forex trading covers one practical way to layer volatility-based stop-loss placement directly onto your TradingView charts.
For traders still refining their core setup criteria, our pin bar trading strategy guide is a useful example of the kind of specific, repeatable pattern that pairs well with a clean TradingView layout — since a well-organized chart is only useful if you have clear criteria for what you’re actually looking for on it.
Common Mistakes When Using TradingView for Analysis
- Overloading charts with too many indicators: More indicators don’t mean better analysis — they often just add conflicting signals and visual clutter.
- Never saving layouts: Rebuilding your setup from scratch every session wastes time and introduces inconsistency into your analysis.
- Ignoring alerts in favor of constant manual checking: This reintroduces the anxiety-driven chart-watching that alerts are specifically designed to prevent.
- Treating Pine Script indicators as automatic signals: Custom scripts are useful filters, not a replacement for judgment about whether a setup genuinely meets your criteria.
Final Thoughts
The best way to use TradingView for analysis isn’t about unlocking some hidden feature — it’s about building a clean, consistent, repeatable workflow using the tools the platform already offers. Saved layouts, multi-timeframe views, alerts instead of constant watching, and organized watchlists all work together to make analysis faster and less error-prone. Start by cleaning up one chart layout and building from there, rather than trying to implement every tip at once — a workflow built gradually and used consistently will always outperform one that’s technically complete but too complicated to actually stick with.
FAQs
Do I need a paid TradingView plan for effective analysis?
The free plan covers most core charting features. Paid tiers add more simultaneous indicators, additional chart layouts, and extra alerts, which become more valuable as your analysis process becomes more advanced and you start running multiple saved layouts or screener filters at once.
How many indicators should I use on one chart?
Most experienced traders keep charts to two or three indicators at most, since too many often create conflicting signals rather than added clarity. A clean chart with a clear purpose usually outperforms a cluttered one, regardless of how sophisticated the individual indicators are.
Is Pine Script necessary to use TradingView effectively?
No. Pine Script is a helpful tool for automating repetitive analysis, but the core charting, alert, screener, and multi-timeframe features work perfectly well without writing any code. It’s worth exploring once your manual workflow is already solid, rather than as a starting point.

