

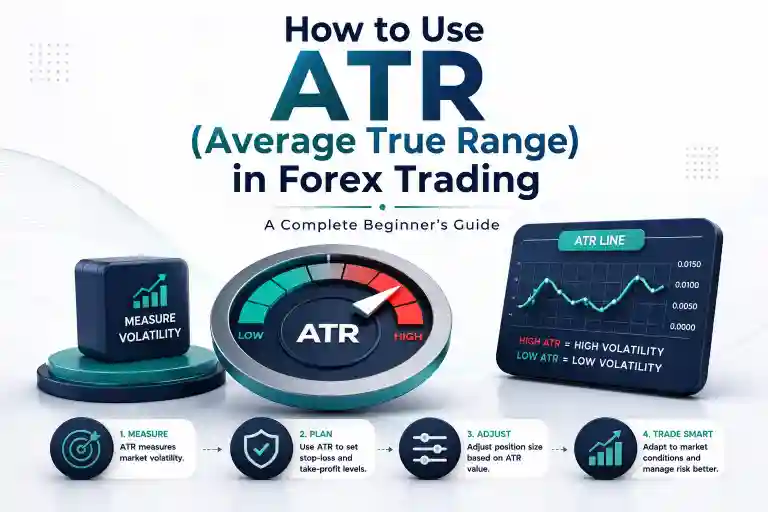
How to Use ATR in Forex Trading is an important concept for traders who want to improve risk management and make more informed trading decisions. One of the biggest mistakes beginners make is focusing only on market direction while ignoring market volatility. A trader may correctly predict that EUR/USD will move higher, but if the stop-loss is placed too close during a highly volatile session, the trade may be closed before the expected move begins.
This is why experienced traders don’t just ask, “Which direction is the market going?” They also ask, “How much is the market likely to move?”
The Average True Range (ATR) is one of the most widely used technical indicators for measuring market volatility. Instead of predicting whether a currency pair will rise or fall, ATR estimates how much the market typically moves over a selected period. This helps traders set more realistic stop-loss levels, identify suitable profit targets, and manage trading risk more effectively.
Unlike many technical indicators, ATR does not generate buy or sell signals. Instead, it measures volatility, making it a useful tool that can complement a wide range of trading strategies, including price action, trend following, breakout trading, and swing trading.
In this guide, you’ll learn how to use ATR in Forex Trading, understand how the indicator works, interpret ATR values correctly, and apply it effectively to improve your trading decisions.
Why Volatility Matters More Than Most Beginners Realize
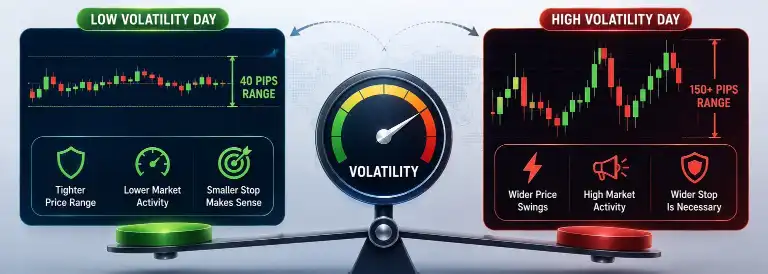
To understand How to Use ATR in Forex Trading, it’s important to first understand market volatility. Every Forex trader knows that price movements vary from one trading session to another. On some days, EUR/USD may move only 40 pips, while on others it can exceed 150 pips due to major economic news or increased market activity.
Using the same stop-loss distance in every market condition can increase trading risk. A stop-loss that is too tight during volatile markets may be triggered too early, while an overly wide stop during calm markets can expose more capital than necessary.
This is where the Average True Range (ATR) becomes valuable. ATR measures recent price movement to show how volatile a currency pair has been over a selected period. Instead of predicting market direction, it helps traders adjust their stop-loss levels and overall risk management based on current market conditions.
Key Takeaway: Learning How to Use ATR in Forex Trading helps traders adapt to changing market volatility, making it easier to manage risk and set more realistic trading levels.
What Is ATR (Average True Range)?
Understanding How to Use ATR in Forex Trading begins with knowing what the Average True Range (ATR) measures. Developed by J. Welles Wilder Jr., ATR is a technical indicator designed to measure market volatility rather than predict price direction.
Unlike indicators such as the Moving Average or RSI, ATR does not indicate whether the market is bullish or bearish. Instead, it calculates the average size of recent price movements over a selected period.
A higher ATR value indicates larger price swings and increased market volatility, while a lower ATR value suggests smaller price movements and relatively stable market conditions.
Because of this, ATR is widely used to adjust stop-loss placement, determine appropriate position sizes, and set realistic trade expectations based on current market activity.
Professional Trader Insight: Experienced traders often use ATR as a risk management tool rather than a buy or sell signal. Learning How to Use ATR in Forex Trading helps traders adapt their risk management to changing market conditions instead of relying on fixed stop-loss distances.
How ATR Measures Market Volatility
Every candlestick has a trading range represented by the difference between its high and low prices.
ATR analyzes these trading ranges over a selected number of periods and calculates an average value.
When recent candles become larger, ATR increases.
When recent candles become smaller, ATR gradually declines.
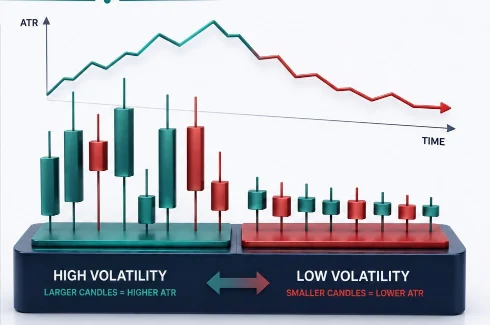
This simple concept allows traders to determine whether the market is becoming more active or more stable.
For example:
- If EUR/USD has an ATR of 30 pips, recent price movement has been relatively limited.
- If ATR rises to 90 pips, daily price swings have increased significantly.
- A rising ATR reflects increasing volatility, while a falling ATR suggests decreasing volatility.
It is important to remember that ATR measures movement, not direction.
The market may rise sharply or fall sharply while ATR increases because volatility has expanded in both situations.
Key Takeaway: ATR tells traders how much the market is moving—not whether it will move up or down.
How ATR Is Calculated (Simple Explanation)
The mathematical formula behind ATR appears complex at first, but understanding the concept is more important than memorizing the calculation.
For each trading period, the indicator determines the True Range (TR), which represents the largest of the following:
- The current high minus the current low.
- The absolute value of the current high minus the previous closing price.
- The absolute value of the current low minus the previous closing price.
After calculating the True Range for each period, the indicator averages these values over a selected number of candles. The most common setting is 14 periods, although traders may choose different values depending on their trading strategy.
You do not need to perform these calculations manually. Trading platforms such as MetaTrader automatically calculate and display ATR in real time.
How to Add ATR on MetaTrader 4 and MetaTrader 5
Adding ATR to your chart is straightforward on both MetaTrader 4 (MT4) and MetaTrader 5 (MT5).
- Open your preferred currency pair.
- Click Insert.
- Select Indicators.
- Choose Oscillators.
- Click Average True Range (ATR).
- Leave the default 14-period setting or adjust it to match your trading strategy.
- Click OK.
The ATR indicator will appear in a separate window below your price chart.
Rather than displaying buy or sell signals, the indicator shows a line that rises and falls as market volatility changes.
How to Read ATR Values Correctly
Learning How to Use ATR in Forex Trading also means understanding what ATR values actually represent. One of the most common mistakes beginners make is assuming that a high ATR indicates a bullish market.
This is a misconception because ATR measures volatility, not market direction.
A rising ATR simply shows that price movements are becoming larger, regardless of whether the market is moving upward or downward. Likewise, a falling ATR indicates that price movements are becoming smaller, suggesting lower market volatility.
To use ATR effectively, traders should focus on the size of price movements rather than trying to interpret ATR as a buy or sell signal. Understanding this distinction is an important step in learning How to Use ATR in Forex Trading for better risk management and more informed trading decisions.
Consider the following examples:
| ATR Reading | Interpretation |
|---|---|
| Low ATR | Market volatility is relatively low and price movements are smaller. |
| Moderate ATR | Normal market conditions with average price movement. |
| High ATR | Large price swings indicate increased market volatility. |
These values should always be interpreted relative to the currency pair and timeframe being analyzed. An ATR value that is considered high on a 15-minute chart may be completely normal on a daily chart.
Professional Trader Insight: Rather than comparing ATR values across different currency pairs, experienced traders compare today’s ATR with the pair’s own historical ATR readings to determine whether volatility is increasing or decreasing.
Common Beginner Mistakes When Using ATR
Mistake 1: Treating ATR as a Buy or Sell Indicator
ATR measures volatility—not trend direction. It should be used alongside other forms of technical analysis instead of acting as a standalone entry signal.
Mistake 2: Ignoring the Trading Timeframe
ATR values vary across different chart timeframes. Always interpret ATR within the timeframe you are trading.
Mistake 3: Using Fixed Stop-Loss Distances
Many beginners place the same stop-loss on every trade regardless of changing market volatility.
ATR encourages traders to adapt their stop-loss placement according to current market conditions.
Key Takeaway: ATR becomes most effective when used as a volatility measurement tool within a complete trading plan rather than as a standalone indicator.
How to Use ATR in Forex Trading for Stop-Loss Placement
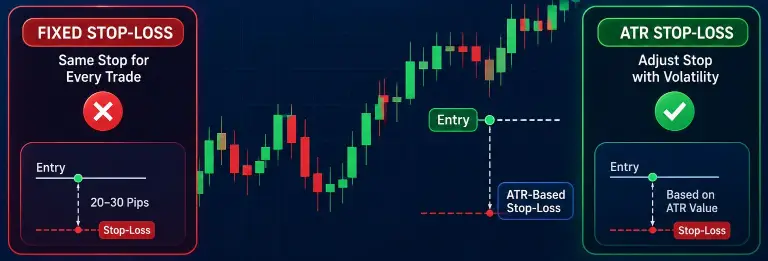
One of the most practical uses of the Average True Range (ATR) is determining more realistic stop-loss levels. Instead of placing a fixed stop-loss of 20 or 30 pips on every trade, ATR helps traders adjust their stop-loss based on current market volatility.
When volatility is low, the market usually moves within a smaller range, so a relatively tighter stop-loss may be appropriate. During highly volatile conditions, however, price fluctuations become larger, meaning a stop-loss that is too close can be triggered even if the overall trade idea remains valid.
Many traders use ATR as a reference rather than an exact rule. For example, if the ATR on the current timeframe is 50 pips, a trader may place the stop-loss at a distance based on that volatility measurement instead of choosing an arbitrary number.
This approach allows the trade more room to fluctuate naturally while still maintaining a predefined level of risk.
Professional Trader Insight: Experienced traders often combine ATR with nearby support and resistance levels rather than relying on ATR alone. This helps create stop-loss placements that reflect both market volatility and price structure.
How to Use ATR for Take-Profit Targets
ATR can also help traders set more realistic profit expectations.
If a currency pair has been moving an average of 40 pips per trading session, expecting a 200-pip move without a strong market catalyst may be unrealistic.
By considering the recent average trading range, traders can estimate whether their planned profit target aligns with current market conditions.
This does not mean every trade should target the exact ATR value. Instead, ATR serves as a volatility guide that helps traders avoid setting profit targets that are either too ambitious or unnecessarily conservative.
Key Takeaway: ATR helps traders match profit expectations with actual market volatility instead of relying on guesswork.
How ATR Helps With Position Sizing
Position sizing and volatility are closely connected.
When market volatility increases, traders often need wider stop-loss distances. If position size remains unchanged, the monetary risk on each trade may become larger than intended.
Many risk-conscious traders adjust their position size whenever ATR changes.
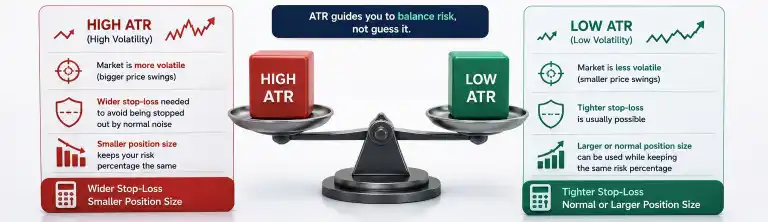
For example:
- Higher ATR generally requires a wider stop-loss and, in many cases, a smaller position size.
- Lower ATR may allow a tighter stop-loss while maintaining the same percentage of account risk.
This approach helps traders maintain consistent risk management across different market conditions.
Using ATR With Price Action
ATR works particularly well when combined with price action analysis.
Instead of entering trades solely because ATR rises or falls, traders first identify high-probability price action signals and then use ATR to manage the trade more effectively.
For example, imagine a bullish pin bar forms at a strong support level during an established uptrend.
The price action signal provides the trade idea, while ATR helps determine whether the stop-loss should allow sufficient room for normal market fluctuations.
Similarly, breakout traders often monitor ATR to determine whether expanding volatility supports the strength of a breakout.
Rather than replacing price action, ATR complements it by providing additional information about current market conditions.
Using ATR With Moving Averages
Moving Averages help traders identify the overall market trend, while ATR measures the strength of recent price movement.
When used together, these indicators can provide a more balanced view of market conditions.
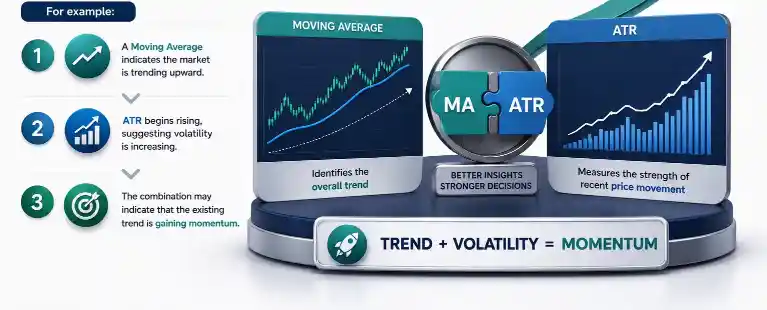
For example:
- A Moving Average indicates the market is trending upward.
- ATR begins rising, suggesting volatility is increasing.
- The combination may indicate that the existing trend is gaining momentum.
Conversely, if ATR declines while the market continues trending, it may suggest that price movement is becoming less dynamic, although the trend itself may still remain intact.
Key Takeaway: ATR measures volatility, while Moving Averages identify direction. Together, they provide complementary information rather than duplicate signals.
ATR vs Bollinger Bands
Both ATR and Bollinger Bands measure aspects of market volatility, but they do so differently.
| Average True Range (ATR) | Bollinger Bands |
|---|---|
| Measures average market volatility. | Measures volatility around a moving average. |
| Does not indicate trend direction. | Can help identify overextended price movement. |
| Commonly used for stop-loss placement. | Commonly used to identify potential volatility expansion or contraction. |
| Appears in a separate indicator window. | Displayed directly on the price chart. |
Many traders use both indicators together because they provide different insights into market behavior.
ATR vs Standard Deviation
Although both indicators relate to volatility, they measure it differently.
| ATR | Standard Deviation |
|---|---|
| Measures the average trading range. | Measures how far prices deviate from the average. |
| Widely used for practical trade management. | Frequently used in statistical market analysis. |
| Simple to interpret. | Requires a stronger understanding of statistical concepts. |
For most beginner Forex traders, ATR is generally easier to understand and apply in everyday trading decisions.
Advantages of Using ATR
- Helps measure current market volatility.
- Supports more realistic stop-loss placement.
- Improves position sizing decisions.
- Works with almost any trading strategy.
- Simple to understand and available on most trading platforms.
Limitations of ATR
- Does not predict market direction.
- Should not be used as a standalone trading signal.
- May react slowly after sudden changes in volatility.
- Works best when combined with price action or other technical analysis tools.
Real Trading Example
Understanding How to Use ATR in Forex Trading becomes easier with a practical example. Suppose a trader identifies a bullish breakout on EUR/USD after several hours of consolidation.
Instead of using a fixed 20-pip stop-loss, the trader checks the current ATR value on the one-hour chart. The indicator shows that the average hourly price movement is around 35 pips.
Based on this information, the trader adjusts the stop-loss to better match current market volatility while maintaining the same level of account risk through proper position sizing. As the trade progresses, the ATR continues to reflect healthy market activity, helping the trader set realistic expectations for potential price movement.
Key Takeaway: This example shows how to use ATR in Forex Trading as a risk management tool. ATR does not generate buy or sell signals—it helps traders adapt their stop-loss placement and trading decisions to current market volatility.
Common Beginner Mistakes
Mistake 1: Comparing ATR Values Across Different Currency Pairs
ATR should be evaluated relative to the historical volatility of the same currency pair rather than compared directly with other pairs.
Mistake 2: Using ATR Alone
ATR measures volatility but does not identify trend direction, support, resistance, or entry signals.
Mistake 3: Ignoring Fundamental Events
Major economic announcements can rapidly increase volatility. ATR reflects recent market activity but should always be interpreted alongside the economic calendar and overall market context.
Final Thoughts
Learning How to Use ATR in Forex Trading helps traders make better risk management decisions by understanding current market volatility instead of trying to predict price direction. ATR can be used to set more appropriate stop-loss levels, estimate realistic profit targets, and adjust position sizes based on changing market conditions.
While ATR is a valuable indicator, it works best when combined with price action, trend analysis, support and resistance, and a well-defined trading plan. By understanding How to Use ATR in Forex Trading and applying it alongside other technical tools, traders can develop a more disciplined and consistent approach to Forex trading.

