


Understanding market structure in forex trading is one of the first real skills that separates traders who read charts with purpose from those who trade on impulse. Once you can identify how price is actually moving — trending, reversing, or ranging — every other tool you use, from support and resistance to entry signals, becomes far more reliable. This guide walks through exactly what market structure means, how to read it, and how beginners can start applying it without getting overwhelmed.
What Is Market Structure in Forex Trading?

Market structure in forex trading refers to the pattern formed by swing highs and swing lows as price moves over time. Rather than looking at a single candle or indicator, market structure gives you the bigger picture — whether the market is trending up, trending down, or moving sideways within a range. Every price chart, regardless of timeframe, is built from this same underlying structure.
Traders who understand market structure can make sense of price action without relying purely on lagging indicators, because the structure itself tells you what the market has already done and gives clues about what it’s likely to do next.
Why Understanding Market Structure Matters for Every Trader
Ignoring market structure is one of the fastest ways to trade against the dominant flow of the market. A trader who buys into what looks like a “dip” without first checking whether the broader structure is bullish or bearish is essentially guessing. Once you can read market structure in forex trading correctly, your entries, stop-loss placement, and target selection all become more logical, because they’re based on where price has actually respected or broken key levels in the past.
The Building Blocks of Market Structure
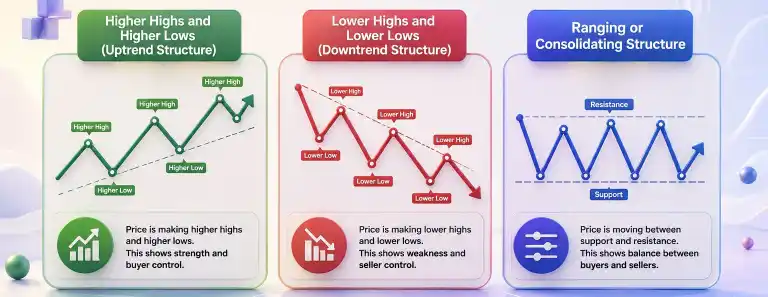
Higher Highs and Higher Lows (Uptrend Structure)
An uptrend forms when price consistently prints higher highs and higher lows. Each pullback finds support above the previous low, showing that buyers remain in control. This is the clearest bullish signature within market structure in forex trading, and it’s usually the first pattern beginners are taught to recognize.
Lower Highs and Lower Lows (Downtrend Structure)
A downtrend mirrors this in reverse — each rally fails below the previous high, and each new low breaks below the last. This consistent lower-high, lower-low pattern signals that sellers are dominant and that buying against the trend carries added risk.
Ranging or Consolidating Structure
Not every market trends. When price oscillates between a relatively fixed ceiling and floor without forming clear higher highs or lower lows, the market is in a range. Recognizing range-bound structure early prevents traders from forcing trend-following strategies onto a market that isn’t actually trending.
How to Identify a Break of Structure (BOS)
A Break of Structure, often shortened to BOS, occurs when price moves beyond a previous significant swing high or low, signaling that the current trend may be continuing or accelerating. For example, in an uptrend, a BOS happens when price breaks above the most recent swing high, confirming that buyers are still in control. Spotting a BOS is one of the most practical ways to confirm that market structure in forex trading is still intact before entering a trade in the direction of the trend.
Change of Character (CHoCH) vs Break of Structure
Where a BOS confirms an existing trend, a Change of Character (CHoCH) signals a potential reversal. A CHoCH occurs when price breaks structure in the opposite direction to the prevailing trend — for instance, when an uptrend that has been printing higher highs and higher lows suddenly breaks below a prior higher low. This shift is often the earliest technical clue that market structure in forex trading is turning, well before a full trend reversal becomes obvious on a higher timeframe.
How Market Structure Helps With Entries

Once structure is mapped out, entries become far more precise. Rather than entering wherever price “looks good,” traders can wait for a retest of a broken structure level, a pullback into a prior support-turned-resistance zone, or a confirmation candle at a key structural point. This is the same principle used in our pin bar trading strategy guide, where price rejection at a structural level is combined with candlestick confirmation to time entries more accurately.
Traders who are still building their foundational approach may also find it useful to review our forex trading strategy for beginners guide, which covers how higher highs, higher lows, and pullback entries work together in a complete strategy.
Market Structure Across Different Timeframes
One of the most important habits to build early is checking market structure in forex trading across more than one timeframe before making a decision. A currency pair might show a clear bullish break of structure on the 15-minute chart while the 4-hour chart is still firmly in a downtrend. Trading the lower timeframe signal in isolation, without checking how it fits into the bigger structural picture, is one of the most common reasons beginner trades fail even when the setup “looked right” in the moment.
A practical approach many traders use is a top-down method: first identify the daily or 4-hour structure to establish overall bias, then drop to a lower timeframe such as the 15-minute or 1-hour chart to time the actual entry once that bias is confirmed. This keeps every trade aligned with the dominant structure rather than fighting it.
How Market Structure Fits Into a Complete Trading Plan

Market structure works best as one component of a broader trading plan rather than a standalone signal. On its own, a break of structure tells you where price has moved — it doesn’t tell you position size, risk tolerance, or when to take profit. Combining structural analysis with clear risk management rules, a defined risk-to-reward target, and a consistent process for confirming entries turns market structure in forex trading from an interesting observation into an actionable trading edge.
Traders who journal their trades often notice a pattern fairly quickly: setups that align with the higher-timeframe structure tend to have meaningfully better outcomes than those that fight it. Keeping a simple log of which trades respected structure and which ignored it is one of the fastest ways to build confidence in this approach.
Common Mistakes Beginners Make When Reading Market Structure
- Marking every minor wiggle as a swing point: Not every small pullback qualifies as a structural high or low — zoom out to focus on the swings that actually matter.
- Ignoring higher timeframes: A break of structure on a 5-minute chart can mean very little if the 4-hour or daily structure is pointing firmly in the opposite direction.
- Trading every BOS blindly: Not every break of structure leads to continuation — confirmation and context still matter.
- Confusing a CHoCH with a full reversal: A change of character is an early warning sign, not automatic proof that the trend has reversed.
Tools to Help You Analyze Market Structure
While market structure itself is read directly from price, a few supporting tools make the process easier. Horizontal lines marking swing highs and lows keep your structure map clean and objective rather than subjective. Volatility indicators can also help confirm whether a break of structure has real momentum behind it — our guide on how to use ATR in forex trading explains how to measure this alongside your structural analysis.
Final Thoughts
Learning to read market structure in forex trading takes practice, but it’s one of the most transferable skills in trading — it works across every currency pair, timeframe, and market condition. Start by simply marking swing highs and lows on a handful of charts, then build up to identifying breaks of structure and changes of character before layering in entry strategies. Once structure becomes second nature, the rest of your analysis becomes noticeably more consistent.
FAQs
Is market structure the same as support and resistance?
They’re closely related but not identical. Market structure describes the pattern of swing highs and lows over time, while support and resistance are the specific price levels that structure often forms around.
What timeframe is best for reading market structure in forex trading?
Higher timeframes like the 4-hour and daily charts generally give a more reliable structural picture, though many traders use them alongside a lower timeframe for entry timing. Relying on a single timeframe when reading market structure in forex trading often leads to conflicting signals and lower-quality entries.
Can beginners use market structure without indicators?
Yes. Market structure is read directly from price action, which makes it one of the more beginner-accessible concepts, though indicators like ATR can add helpful confirmation when analyzing market structure in forex trading alongside volatility.
How long does it take to get good at reading market structure?
Most traders start recognizing basic swing highs and lows within a few weeks of deliberate practice, but consistently applying market structure in forex trading to real entries and risk management typically takes a few months of screen time and journaling.

