


One of the most challenging skills in Forex trading is identifying when a trend is likely to end and a new move may begin. Many traders attempt to predict market reversals using indicators, oscillators, or complex trading systems. While these tools can provide useful information, experienced traders often place greater emphasis on price action itself.
Price action reflects the real-time battle between buyers and sellers. Every candlestick, swing high, swing low, and breakout represents decisions being made by market participants. By learning how to interpret these movements, traders can often identify potential market reversals before they become obvious to the broader market.
It is important to understand that no trader can predict every reversal with complete accuracy. Markets are influenced by numerous factors, including economic data, institutional order flow, market sentiment, and global events. However, professional traders use price action analysis to improve the probability of identifying meaningful turning points while managing risk effectively.
In this guide, we will explore how professional traders identify market reversals using price action, the key signs they watch for, and how traders can incorporate these concepts into their own analysis.
What Is a Market Reversal?
A market reversal occurs when an existing trend changes direction.
For example:
- An uptrend transitions into a downtrend.
- A downtrend transitions into an uptrend.
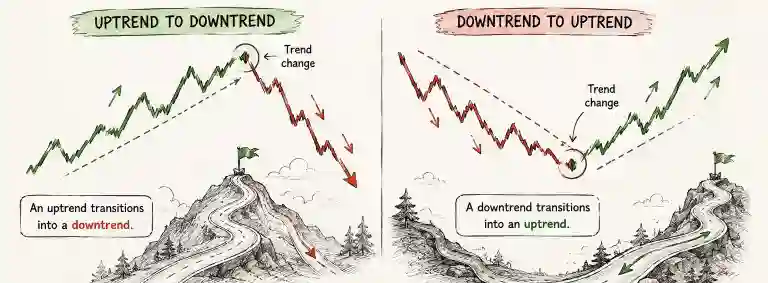
Reversals differ from temporary pullbacks or corrections. During a pullback, the market moves against the dominant trend for a short period before continuing in the original direction.
A true reversal represents a more significant shift in market sentiment and structure.
One reason traders study how professional traders identify market reversals using price action is because catching the early stages of a reversal can offer favorable risk-to-reward opportunities.
Why Price Action Is Important for Reversal Analysis
Price action focuses on the direct movement of price without relying heavily on lagging indicators.
Indicators often derive their signals from historical price data. By the time an indicator confirms a reversal, a significant portion of the move may have already occurred.
Price action allows traders to observe market behavior as it develops.
Professional traders often analyze:
- Market structure
- Candlestick formations
- Support and resistance levels
- Momentum changes
- Liquidity zones
- Breakouts and failed breakouts
These elements provide valuable clues regarding potential changes in market direction.
How Professional Traders Identify Market Reversals Using Price Action Through Market Structure
One of the most reliable methods professionals use is analyzing market structure.
Every trend creates a sequence of highs and lows.
In an uptrend, price generally forms:
- Higher highs
- Higher lows
In a downtrend, price generally forms:
- Lower highs
- Lower lows
A potential reversal begins when this structure starts to change.
For example, during an uptrend:
- Price fails to create a new higher high.
- A key higher low is broken.
- A lower high forms.
These developments suggest that buyers may be losing control.
Professional traders pay close attention to these structural shifts because they often provide the earliest indications of a possible reversal.
The Role of Support and Resistance in Reversal Trading
Support and resistance levels are among the most important areas professional traders monitor.
These zones often represent locations where significant buying or selling interest previously entered the market.
When price approaches a major support or resistance area, traders watch carefully for signs of rejection.
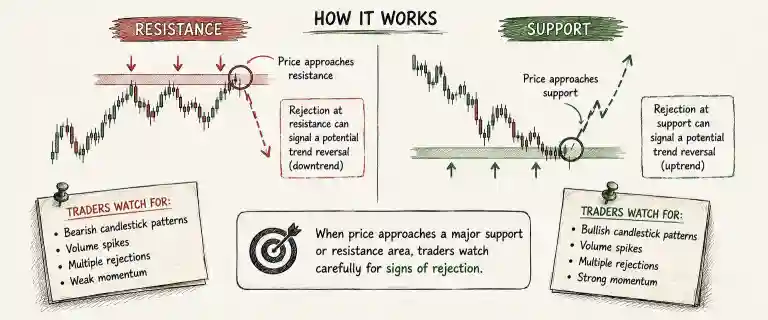
Common observations include:
- Strong reversal candles
- Repeated failures to break a level
- Sharp momentum shifts
- False breakouts
The stronger and more respected a level has been historically, the greater its potential significance.
Many examples of how professional traders identify market reversals using price action involve reactions at major support and resistance zones.
Key Candlestick Patterns That Signal Potential Reversals
Candlestick formations provide valuable insight into the balance between buyers and sellers.
While no pattern guarantees a reversal, certain formations frequently attract attention from professional traders.
- Pin Bar: A pin bar is a candlestick pattern characterized by a long wick and a relatively small body. It reflects a situation where price attempted to move in one direction but was unable to maintain momentum, resulting in a strong rejection.
When a bullish pin bar forms near a support level, it may indicate growing buying interest and the potential for an upward move. Conversely, a bearish pin bar appearing near resistance can suggest that sellers are gaining control and that downward pressure may be increasing.
- Engulfing Pattern: An engulfing pattern is a candlestick formation in which the body of one candle completely encompasses the body of the previous candle. This pattern is often viewed as a sign of changing market sentiment and increasing momentum in the direction of the engulfing candle.
Traders frequently look for bullish or bearish engulfing patterns near key support and resistance levels, as they can provide additional confirmation of a potential market reversal or continuation.
- Morning Star and Evening Star: Multi-candle formations are candlestick patterns that develop over two or more candles and can signal a shift in control between buyers and sellers. These patterns often reflect changes in market sentiment and may provide valuable insight into potential price direction.
While they occur less frequently than pin bars or engulfing patterns, traders often pay close attention to them when they form near significant support or resistance levels, where they can offer additional confirmation of a potential market reaction.
Failed Breakouts Often Lead to Reversals
One of the most valuable concepts in price action trading is the failed breakout. A breakout occurs when price moves beyond a key support or resistance level, but not every breakout leads to a sustained trend.

In some cases, price briefly breaks through a level, attracts breakout traders, and then quickly reverses back into the previous range. This behavior can indicate that the market lacked sufficient momentum to continue in the breakout direction.
Experienced traders often pay close attention to failed breakouts because they can signal potential market reversals. Recognizing these situations is an important part of understanding how professional traders identify market reversals using price action.
Liquidity Sweeps and Reversal Opportunities
Liquidity plays an important role in price action analysis because financial markets require a constant flow of buy and sell orders. Large institutions often need significant liquidity to execute positions efficiently, which can cause price to move toward areas where orders are concentrated.
In many cases, this results in price briefly moving beyond recent highs or lows, triggering stop-loss orders before reversing direction. This behavior is commonly known as a liquidity sweep. Traders often monitor these movements because they can provide valuable clues about potential market reversals when combined with other price action signals.
Momentum Changes Can Signal a Potential Reversal
Strong trends are typically characterized by consistent momentum.
Price moves decisively in the direction of the trend, and pullbacks remain relatively shallow.
As trends weaken, several warning signs may emerge:
- Reduced momentum
- Smaller trend extensions
- Longer consolidation periods
- Increasing rejection candles
- Difficulty creating new highs or lows
While these signs do not guarantee a reversal, they often indicate that the existing trend may be losing strength.
Professional traders use these clues to prepare for potential changes in market direction.
Multi-Timeframe Analysis Improves Reversal Identification
Experienced traders rarely rely on a single chart timeframe when evaluating reversals.
Instead, they use multiple timeframes to gain broader market context.
For example:
- Daily chart for overall market structure
- 4-Hour chart for setup identification
- 1-Hour chart for entry confirmation
This approach helps traders avoid reacting to minor fluctuations that may appear significant on lower timeframes but are insignificant within the larger trend.
Multi-timeframe analysis is often a critical component of how professional traders identify market reversals using price action.
Common Mistakes Traders Make When Looking for Reversals
- Trying to Predict Every Top and Bottom: One of the most common mistakes among beginner traders is trying to predict exact market tops and bottoms. This approach often results in entering trades prematurely and trading against established trends.
Experienced traders generally prefer to wait for clear confirmation before entering a position. By allowing the market to reveal signs of a potential reversal, they can reduce unnecessary risk and make more informed trading decisions.
- Ignoring the Broader Trend: Countertrend trading can be challenging because a temporary pullback does not necessarily signal a genuine market reversal. Many traders make the mistake of assuming that every short-term correction marks the beginning of a new trend.
By analyzing the broader market structure and overall trend direction, traders can avoid low-probability setups and make more informed trading decisions. Understanding the bigger picture is often essential when evaluating potential reversal opportunities.
- Relying on a Single Signal:Professional traders rarely rely on a single candlestick pattern when making trading decisions. Instead, they seek additional confirmation from multiple factors, including market structure, key support and resistance levels, liquidity behavior, and overall market momentum.
By combining several forms of analysis, traders can build stronger trade setups and reduce the likelihood of acting on weak or misleading signals. This approach helps improve decision-making and increases confidence in potential reversal opportunities.
A Practical Example of Price Action Reversal Analysis
Imagine EUR/USD has been in a strong uptrend for several weeks.
Price eventually reaches a major resistance level visible on the Daily chart.
At this level:
- A bearish pin bar forms.
- Price fails to create a new higher high.
- A lower high develops.
- A key support level breaks.
Individually, these signals may not be sufficient.
Together, however, they provide multiple indications that buying pressure is weakening.
This type of confluence is often what professional traders seek before considering a reversal trade.
Risk Management Remains Essential
Even the strongest reversal setups can fail.
Unexpected news events, institutional activity, or shifts in market sentiment can invalidate a reversal signal.
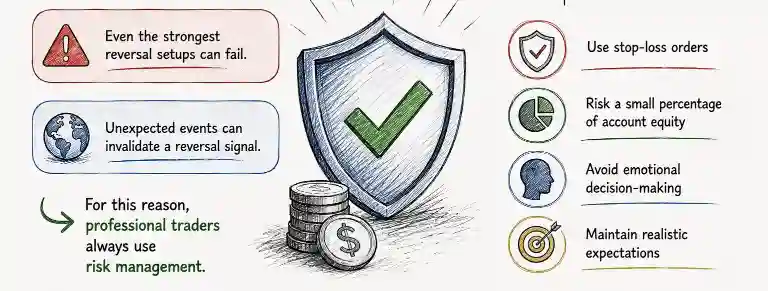
For this reason, professional traders always use risk management.
Key principles include:
- Using stop-loss orders
- Risking a small percentage of account equity
- Avoiding emotional decision-making
- Maintaining realistic expectations
Successful reversal trading is not about being right on every trade. It is about managing risk while consistently identifying favorable opportunities.
Final Thoughts
Learning how professional traders identify market reversals using price action can provide valuable insight into market behavior. Instead of relying exclusively on indicators, experienced traders analyze factors such as market structure, support and resistance levels, candlestick patterns, liquidity areas, and momentum changes when assessing potential reversal opportunities.
Although no technique can identify every market turning point, combining multiple forms of confirmation can help improve trade selection and reduce common trading mistakes. Professional traders understand that reversals are rarely confirmed by a single signal. Rather, they look for a combination of technical factors that suggest control may be shifting between buyers and sellers.
By focusing on price action and applying disciplined risk management, traders can develop a more structured and objective approach to identifying potential market reversals.

