

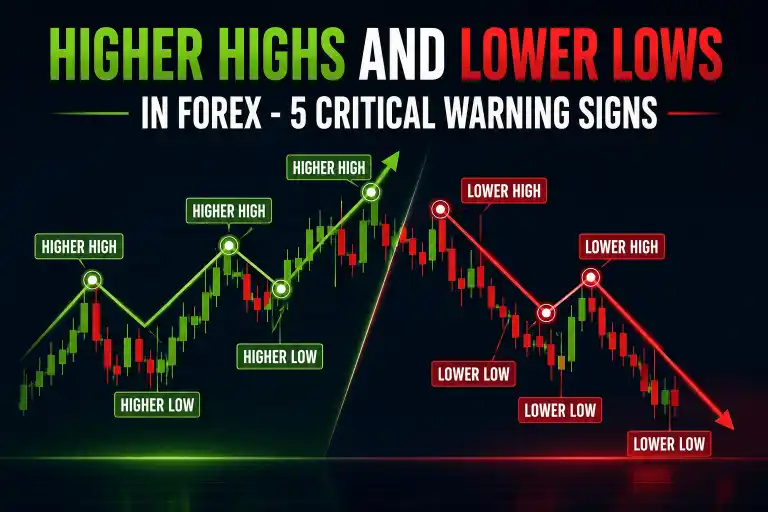
Spotting higher highs and lower lows in forex at the same time — rather than a clean, consistent trend structure — is one of the earliest technical clues that a trend may be losing strength. Most traders learn to recognize a clean uptrend or downtrend easily, but the messier transition period in between, where both patterns start appearing together, is where costly mistakes tend to happen. This guide breaks down five critical warning signs to watch for in that transition zone.
What Do Higher Highs and Lower Lows Actually Mean?
In a healthy uptrend, price consistently prints higher highs and higher lows — each pullback holds above the prior low. In a healthy downtrend, the reverse is true: lower highs and lower lows. When a chart starts showing higher highs and lower lows in forex mixed together — a higher high followed shortly by a lower low, or vice versa — it signals that neither buyers nor sellers are fully in control, which is exactly the kind of structural ambiguity that precedes many trend reversals.
Why Seeing Both Patterns Together Is a Warning Sign
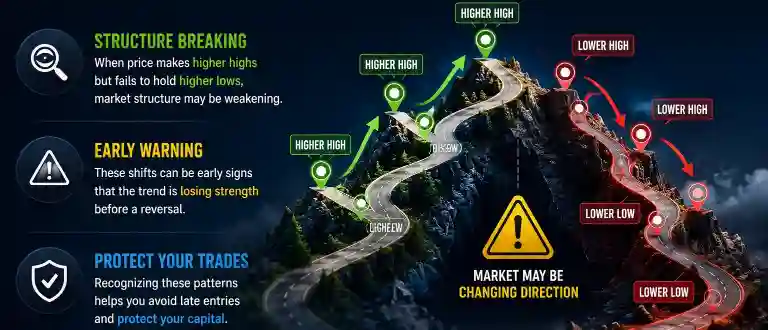
A trend, by definition, requires consistency in its swing structure. When that consistency breaks — for example, price forms a higher high but fails to hold the previous higher low — the market may be signaling a change before the overall direction officially reverses. Recognizing higher highs and lower lows in forex can help traders identify these structural shifts and avoid continuing to trade an old trend when reversal signals are already developing.
Traders who ignore these changes in swing structure may get caught by reversals that become obvious only after the move is already underway. Looking beyond simple trendlines and focusing on how price forms and protects its highs and lows can provide a clearer view of changing market conditions.
5 Critical Warning Signs to Watch For
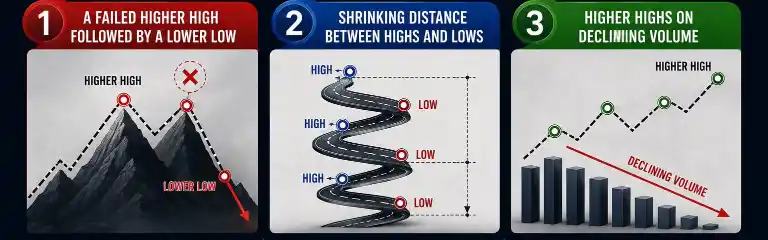
1. A Failed Higher High Followed by a Lower Low
This is one of the clearest warning signs of a weakening trend: price appears to form a fresh higher high, then reverses and breaks below the previous swing low. This sequence can provide early evidence that the uptrend’s structure has been damaged and that the higher highs and lower lows in forex pattern may be starting to change.
2. Shrinking Distance Between Highs and Lows
As a trend weakens, the distance between each new high and low often starts contracting, even before an outright structural break occurs. This narrowing range can signal indecision building beneath the surface of what still looks like a functioning trend.
3. Higher Highs on Declining Volume
When price continues printing higher highs but the volume or momentum behind each new high is visibly weaker than the last, it suggests the move is running out of genuine participation, even though the price structure alone still looks bullish.
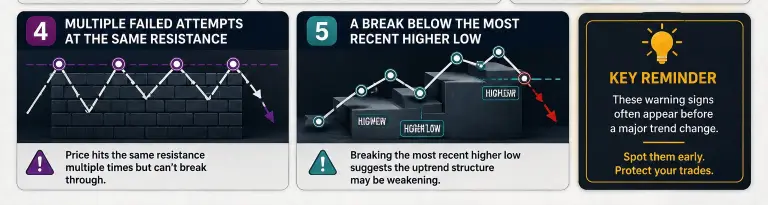
4. Multiple Failed Attempts at the Same Resistance
Repeated failed attempts to break above the same level — rather than one clean breakout — often precede the kind of higher-high, lower-low mixing that signals a stalling trend rather than genuine continuation.
5. A Break Below the Most Recent Higher Low
This is the most decisive of the five signs. When price breaks below the most recent higher low in an uptrend, the basic structure of higher highs and lower lows in forex has been disrupted, even if the broader trendline still appears intact. A break of this key swing level can therefore provide a stronger indication of a potential trend change than the trendline alone.
How This Connects to Market Structure and Trend Reversals
These five warning signs are really just specific, actionable versions of a broader market structure concept — the same one covered in more depth in our complete guide to market structure in forex trading, which explains break of structure and change of character in detail. Watching for higher highs and lower lows mixing together is essentially an early, practical way to spot a potential change of character before it’s fully confirmed.
How to Confirm a Genuine Reversal vs. a Temporary Pullback
Not every instance of higher highs and lower lows appearing together leads to a full reversal — sometimes it’s just a deeper-than-usual pullback within an otherwise intact trend. A useful way to tell the difference is checking whether price eventually reclaims the broken level with strong momentum, which suggests a temporary pullback, versus continuing to build a new, opposite structure over several more swings, which suggests a genuine reversal is underway. Patience here matters — this is exactly the kind of situation where a tested trading strategy with clear confirmation rules prevents jumping to conclusions too early.
How Timeframe Affects These Warning Signs
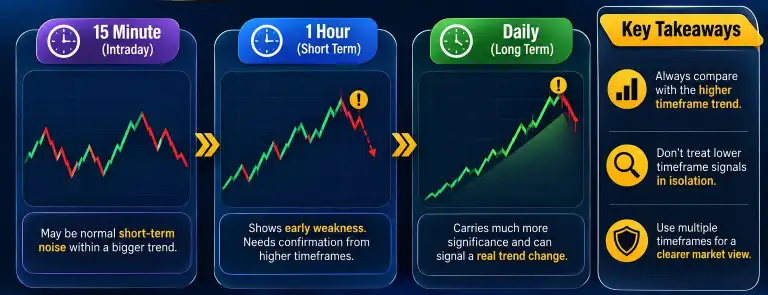
The same mix of higher highs and lower lows in forex can have very different meanings depending on the timeframe. A structural warning on a 15-minute chart may simply be normal intraday noise within a broader daily uptrend, while the same pattern on a daily chart can carry much more significance. Traders who spot this type of mixed structure on a lower timeframe should check the higher-timeframe trend before treating it as a meaningful reversal signal, as short-term fluctuations often occur without changing the broader market direction.
A practical approach is to treat lower-timeframe warning signs as a reason to review or tighten management of existing trades, while reserving major changes in directional bias for signals confirmed on the timeframe primarily used for trend analysis. This helps traders avoid overreacting to minor price fluctuations while still responding when the broader market structure genuinely begins to change.
A Practical Example
Imagine a currency pair in a clear uptrend that suddenly prints a new higher high, only to reverse sharply and break below the prior swing low within the same session. At this point, warning signs one and five from the list above have both triggered. A disciplined trader would tighten stops on any existing long positions and hold off on new trend-continuation entries until price either reclaims the broken structure or confirms a fresh downtrend with its own consistent lower highs and lower lows. Traders who ignore this signal and keep buying pullbacks purely because “the trend has been up” are the ones most likely to be caught by the reversal once it fully confirms.
Common Mistakes When Reading Higher Highs and Lower Lows
- Reacting to a single failed swing too early: One failed higher high doesn’t automatically confirm a reversal — context and confirmation matter.
- Ignoring the signal because “the trend has been strong”: A trend’s recent strength doesn’t prevent structural warning signs from being valid.
- Not adjusting risk once structure starts weakening: Even before a full reversal confirms, tightening stops or reducing size during a structural warning phase is a reasonable, disciplined adjustment.
- Confusing normal volatility with a genuine structural break: Not every larger-than-usual pullback signals a change of character — comparing the move to the pair’s typical volatility helps avoid overreacting to normal noise.
Final Thoughts
Watching for higher highs and lower lows in forex appearing together gives traders an early, practical signal that a trend’s structure may be weakening — often before it becomes obvious through a simple trendline break. None of these five signs guarantee a reversal on their own, but together, they build a case worth paying close attention to, particularly when several appear in the same stretch of price action. Combining this awareness with clear confirmation rules, rather than reacting to the first warning sign alone, keeps this technique useful rather than a source of premature exits — and pairing it with sound timeframe context, as discussed above, prevents overreacting to what may simply be normal short-term noise.
FAQs
Does one failed higher high always mean a trend reversal?
No. A single failed swing is a warning sign, not confirmation — traders typically look for additional signs or a clear structural break before treating it as a genuine reversal, especially on lower timeframes where noise is more common.
How is this different from a normal pullback?
A normal pullback usually respects the prior swing low and resumes the trend; a structural warning sign involves an actual break below that level, followed by continued weakening structure rather than a quick recovery back into the original trend direction.
Should I exit a trade immediately when I see one of these warning signs?
Many traders instead tighten stops or reduce position size at the first warning sign, reserving a full exit or reversal trade for clearer, multi-sign confirmation across a timeframe they trust for directional bias.

