

Support and resistance are among the most widely used concepts in forex trading and continue to play an important role in market analysis in 2026. These key price levels help traders identify areas where buying or selling pressure may influence future market movements.
While many traders rely on technical indicators, price action traders often focus on the market’s raw price behavior. Since indicators are based on historical data and can sometimes lag behind price movements, analyzing support and resistance directly from the chart can provide a clearer view of market structure.
Learning to trade support and resistance without indicators can help traders simplify chart analysis, improve decision-making, and better understand how price reacts at important market levels. By focusing on pure price action, traders can identify potential trading opportunities based on actual market behavior rather than indicator signals.
In this guide, we’ll explain how support and resistance work, how to identify these levels using price action, and how traders can apply them to improve their trading decisions in today’s forex market
What Are Support and Resistance Levels
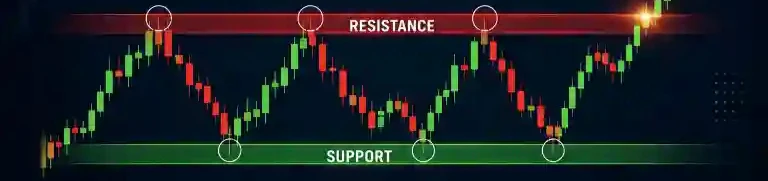
Support and Resistance Without Indicators is a popular price action approach that focuses on identifying key market levels directly from the chart. Support and resistance are price zones where the market has historically experienced strong buying or selling activity, often acting as barriers that influence future price movements.
Support is a price area where buying pressure has previously been strong enough to slow or reverse a decline. Resistance, on the other hand, is an area where selling pressure has historically limited upward price movement.
These levels are important because they often reflect areas where traders, institutions, and other market participants are actively making decisions. Unlike technical indicators that react to past price action, support and resistance can help traders identify potential turning points and high-interest trading zones before significant market moves occur.
- Understanding Support: When price falls into a support zone, buyers may enter the market and create upward pressure, often leading to a price reaction that traders can analyze. Although support does not guarantee a reversal, levels that have been respected multiple times in the past are generally considered more significant and may attract greater attention from market participants.
- Understanding Resistance: Resistance works in the opposite way. When price approaches a resistance zone, selling pressure may increase, potentially slowing, stalling, or reversing an upward move. While resistance does not guarantee a market reversal, levels that have been tested multiple times without being broken are often viewed as more significant and tend to attract greater attention from traders.
Why Support and Resistance Matter in Real Trading
When trading Support and Resistance Without Indicators, understanding overall market structure is just as important as finding entry signals. Many beginner traders focus only on trade entries while overlooking where price is positioned within the broader market context.
For example, a strong bullish price action pattern forming directly below a major resistance level may have a lower probability of success than the same pattern developing at a well-established support zone. By analyzing market location alongside support and resistance levels, traders can identify higher-quality setups and make more informed trading decisions.
Support and resistance help traders answer critical questions:
- Where are buyers likely to become active?
- Where are sellers likely to defend positions?
- Where should stop-loss orders be placed?
- Where can realistic profit targets be identified?
- Is the risk-to-reward ratio favorable?
Without understanding these levels, traders often enter positions at poor locations and expose themselves to unnecessary risk.
How to Identify Support and Resistance Without Indicators
The advantage of price action trading is that support and resistance can be identified using nothing more than a clean chart.
1. Look for Historical Swing Highs and Swing Lows
One of the most effective ways to identify support and resistance is by analyzing previous swing highs and swing lows on the chart. Areas where price has repeatedly reversed or reacted often become important levels that traders monitor closely.
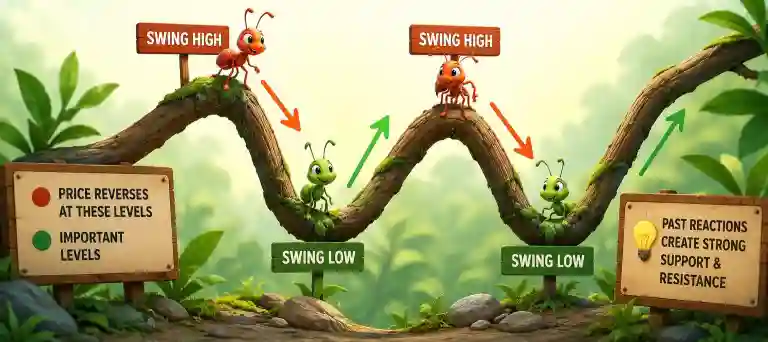
Swing highs frequently act as future resistance, while swing lows often serve as future support. When price continues to react around the same zone, it suggests that market participants consider that area significant.
Rather than drawing precise lines, many experienced traders prefer marking support and resistance as zones, since price rarely reverses at an exact level and often fluctuates within a broader area.
2. Identify Repeated Market Reactions
Support and resistance levels generally become more significant when price reacts to the same area multiple times. Repeated bounces or reversals suggest that buyers or sellers continue to view the zone as important, increasing its relevance for future price movements.
3. Use Round Numbers
Psychological price levels continue to influence the forex market in 2026.

Major round numbers such as:
- 1.1000 on EUR/USD
- 150.00 on GBP/JPY
- 100.00 on USD/JPY
often attract significant trading activity because institutional and retail traders frequently place orders around these levels.
While round numbers should not be traded blindly, they can strengthen existing support or resistance zones.
4. Analyze Market Structure
When trading Support and Resistance Without Indicators, understanding market structure can provide valuable insights into the strength and relevance of key price levels. In an uptrend, a previous resistance level may become new support after a successful breakout, a concept commonly known as role reversal.
Likewise, in a downtrend, former support levels can become new resistance. Monitoring these transitions can help traders better understand shifts in market sentiment and identify potential trend continuation opportunities..
Powerful Price Action Techniques for Trading Support and Resistance
1. Pin Bar Rejections
A pin bar is one of the most popular price action patterns used by traders to identify potential market reversals. When a pin bar forms near a significant support or resistance level, it may signal strong price rejection and increased buying or selling pressure.
For example, a bullish pin bar with a long lower wick forming at a support zone can indicate that buyers are defending the level and pushing prices higher. Many price action traders use pin bars as a confirmation signal before entering a trade, helping them avoid weaker setups and improve trade selection.
2. Engulfing Candlestick Patterns
When trading Support and Resistance Without Indicators, engulfing patterns can serve as valuable confirmation signals. These price action patterns are commonly used to identify potential shifts in market sentiment, especially when they form near significant support or resistance zones.
A bullish engulfing pattern at support may indicate increasing buying pressure, while a bearish engulfing pattern at resistance can suggest growing selling momentum. In general, engulfing patterns tend to be more reliable when they align with well-established support and resistance levels.
3. False Breakouts
One of the most effective price action opportunities can emerge from false breakouts. A false breakout occurs when price temporarily moves beyond a support or resistance level before quickly reversing back into the established range.

These movements often trap traders who enter positions based solely on the initial breakout signal, creating momentum in the opposite direction. Rather than reacting immediately, experienced traders typically wait for confirmation that the breakout has failed before considering a trade entry. This approach can help reduce false signals and improve overall trade quality.
4. Break and Retest Strategy
Rather than entering immediately after a breakout, many professional traders wait for price to return and retest the broken level.
If previous resistance becomes support and price shows bullish rejection, the probability of continuation may improve.
This approach often provides better risk-to-reward opportunities than chasing aggressive breakout moves.
Real-World Trading Example
To understand how Support and Resistance Without Indicators works in practice, imagine EUR/USD trading between 1.1200 and 1.1300 for several weeks. The 1.1200 area repeatedly acts as support, while 1.1300 continues to limit upward price movements.
As price revisits the support zone, a bullish engulfing candle forms, signaling buying interest and rejection of lower prices. A price action trader may interpret this as confirmation that buyers are defending the level.
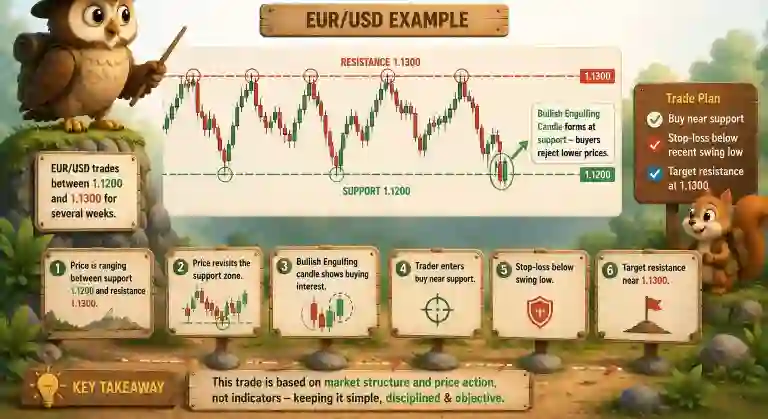
Based on this analysis, the trader enters a buy position near support, places a stop-loss below the recent swing low, and targets the resistance zone near 1.1300. The trade is based on market structure and price action rather than technical indicators, helping maintain a disciplined and objective trading approach.
Practical Tips for Trading Support and Resistance Successfully
- Use clean charts with minimal distractions.
- Focus on higher time frame levels first.
- Treat support and resistance as zones rather than exact lines.
- Wait for confirmation through price action.
- Combine market structure with candlestick analysis.
- Maintain a favorable risk-to-reward ratio.
- Keep a trading journal to track performance.
- Avoid forcing trades when price action is unclear.
Consistent profitability often comes from patience and selective execution rather than frequent trading.
Trader Insight
One lesson often emphasized by experienced traders who use Support and Resistance Without Indicators is that the strongest levels are usually the most obvious. When a support or resistance zone stands out clearly on the chart, it is likely attracting attention from many other market participants as well, increasing the potential for a meaningful price reaction.
At the same time, support and resistance should never be treated as guaranteed reversal points. Instead, they are areas of interest where traders look for signs of buying or selling pressure. Successful traders remain flexible, adapt to changing market conditions, and base their decisions on actual price behavior rather than assumptions about how the market should react.
Advantages and Limitations of Trading Support and Resistance Without Indicators
Advantages and Limitations of Trading Support and Resistance Without Indicators
Advantages
- Provides a cleaner and less cluttered view of price action.
- Helps traders develop a stronger understanding of market structure.
- Reduces reliance on lagging technical indicators.
- Can be applied across different currency pairs, assets, and time frames.
- Supports more effective risk-to-reward planning and trade management.
- Assists in identifying potential high-probability entry and exit zones.
Limitations
- Requires experience and consistent chart observation to master.
- Support and resistance levels can be interpreted differently by individual traders.
- False breakouts and temporary price violations may occur.
- No support or resistance level can guarantee a market reversal or continuation.
- Patience is often required to wait for confirmation before entering a trade.
This version sounds more professional and educational, which is better for SEO and AdSense-focused forex content.
Final Thoughts
Trading support and resistance without indicators remains a valuable skill for forex traders in 2026. By focusing on price action and market structure, traders can identify potential trading opportunities, improve risk management, and make more informed decisions.
While no strategy guarantees success, combining support and resistance analysis with disciplined trading practices can provide a clear and effective framework for navigating the forex market. Ultimately, long-term consistency comes from understanding price behavior and managing risk responsibly.