

Technical analysis in forex is one of the most widely used methods to study the market and make trading decisions. It focuses on analyzing price charts and historical data to predict future price movements. Instead of relying on news or economic reports, traders using technical analysis depend on price behavior and patterns.
For beginners, understanding technical analysis in forex is essential because it helps identify trends, entry points, and exit levels with more clarity and confidence.
What is Technical Analysis in Forex
In simple terms, technical analysis in forex refers to the study of price charts, patterns, and indicators to understand how the market behaves. Traders analyze past price movements to anticipate what might happen next.
This approach assumes that all available information is already reflected in the price. Therefore, by studying charts, traders can identify opportunities without needing to analyze external factors.
Core Elements of Technical Analysis
To fully understand technical analysis in forex, you need to know the main components involved:
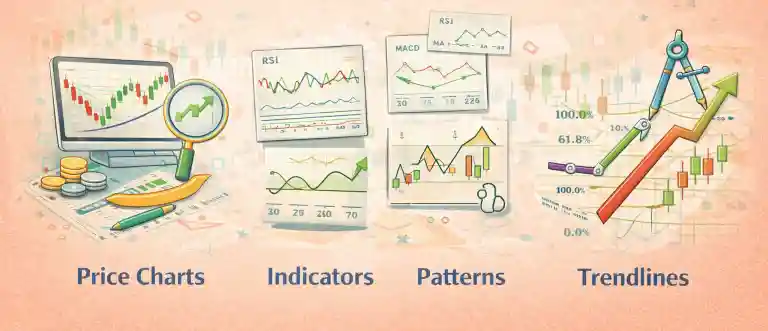
- Price Charts: Visual representation of market movement
- Patterns: Repeating formations in price behavior
- Indicators: Mathematical tools used to analyze trends
- Market Trends: Overall direction of price movement
All these elements work together to help traders interpret market conditions effectively.
Basic Principles of Technical Analysis
There are three fundamental principles behind technical analysis in forex that every beginner should understand.
- Price Reflects Everything: This principle suggests that all information—whether economic, political, or psychological—is already included in the price. Traders focus only on price movements rather than external data.
- Markets Move in Trends: Price does not move randomly. Instead, it follows trends such as upward, downward, or sideways movement. Identifying these trends is a key part of technical analysis.
- History Tends to Repeat: Market behavior often repeats over time because trader psychology remains similar. Patterns seen in the past may appear again in the future.
Types of Charts in Forex
Charts are the foundation of technical analysis in forex. Different types of charts provide different insights.
1. Line Chart
- Simple and easy to understand
- Displays closing prices only
- Best for identifying overall trends
2. Bar Chart
- Shows open, high, low, and close prices
- Provides more detailed information
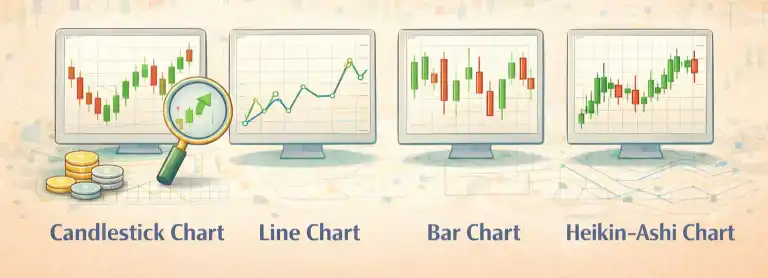
3. Candlestick Chart
- Most popular among traders
- Easy to visualize price action
- Shows market sentiment clearly
Candlestick charts are widely preferred because they provide more detailed and readable price information.
4. Heikin Ashi Chart
Heikin Ashi is a modified type of candlestick chart that smooths out price movements to make trends easier to identify.
- Filters market noise
- Helps in spotting strong trends
- Ideal for trend-following strategies
Unlike traditional candlesticks, Heikin Ashi uses average price values, which makes the chart look smoother and more consistent.
Important Tools in Technical Analysis
Several tools are used in technical analysis in forex to improve accuracy and decision-making.
- Support and Resistance: These are key price levels where the market tends to react, reverse, or pause.
- Trendlines: Trendlines help traders visualize the direction of the market and identify potential entry points.
- Indicators: Indicators are mathematical calculations based on price data. Common examples include: Moving Average, RSI (Relative Strength Index) and MACD
- Chart Patterns: Chart patterns are formations that signal potential price movements. Popular patterns include:
- Head and Shoulders
- Double Top and Double Bottom
- Triangle patterns
Technical Analysis vs Fundamental Analysis
To better understand technical analysis in forex, it’s helpful to compare it with fundamental analysis.
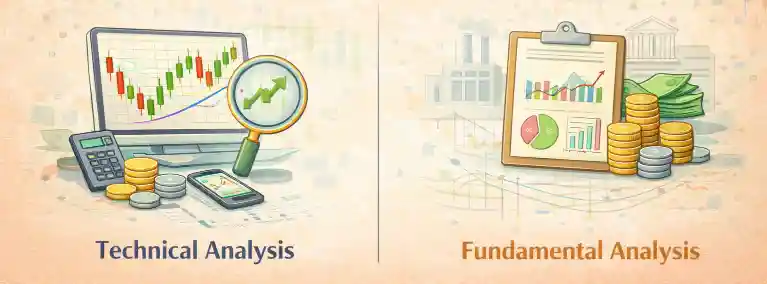
- Technical Analysis: Focuses on charts, patterns, and price movement
- Fundamental Analysis: Focuses on economic data, news, and global events
Many traders combine both approaches to gain a more complete view of the market.
Why Technical Analysis is Important
Using technical analysis in forex offers several advantages:
- Helps identify precise entry and exit points
- Improves overall trading accuracy
- Supports structured decision-making
- Applicable in different market conditions
This makes it a valuable skill for both beginners and experienced traders.
Common Mistakes Traders Make
Even after learning technical analysis in forex, beginners often make avoidable mistakes:
- Using too many indicators at once
- Ignoring the overall market trend
- Trading without proper risk management
- Depending on a single indicator
Keeping your strategy simple and disciplined is key to long-term success.
Pro Tips for Beginners
To use technical analysis in forex effectively, follow these practical tips:
- Keep your charts clean and simple
- Focus on price action before indicators
- Use multiple tools for confirmation
- Practice regularly on demo accounts
- Always follow proper risk management
Final Thoughts
Technical analysis in forex is a powerful method that helps traders understand market behavior and make informed decisions. By studying charts, patterns, and indicators, traders can gain valuable insights into price movement.
For beginners, mastering technical analysis can significantly improve trading confidence and performance over time. With consistent practice and proper strategy, it becomes an essential part of successful trading.
To apply technical analysis effectively, you should also learn about Support and Resistance in Forex, Trend in Forex, and Order Types in Forex, as they are essential tools used in chart analysis.